Quick Start: The Fire Environment
Several control panels are used to describe the fire's environment. These controls are all dynamically coupled to the fire behavior outputs. Any change to the environment will be reflected immediately in the fire behavior display panels.
Solar Preheating by Date and Time
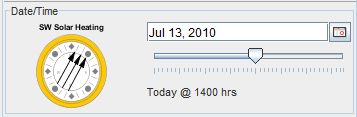
Figure 6. Solar Heating and Date and Time controls.
Solar preheating is controlled by date, time and location. This panel allows you to input the date and time. Note that the location is controlled by the map viewer.
The direction of the solar rays is shown within the yellow compass rose.
Fuel Models
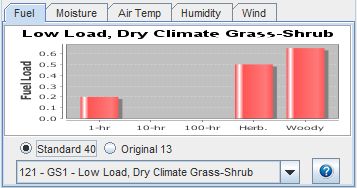
Figure 7. Fuel tab showing the selected fuel model with a fuel
load graph
The Fuel tab contains a control for selecting a fuel model. A graph of the fuel load is shown for the selected model. Clicking the [?] icon will display a help guide with photos to assist you in selecting the appropriate fuel model.
Fuel Moisture Scenarios
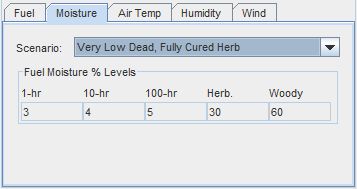
Figure 8. Moisture tab showing a selected fuel moisture scenario
The Moisture tab allows you to select the initial fuel moistures used in the fire behavior calculations. Note that the 1-hour dead fuel moisture level will be adjusted according to hourly air temperature, humidity and solar heating.
Air Temperature - Yesterday and Today
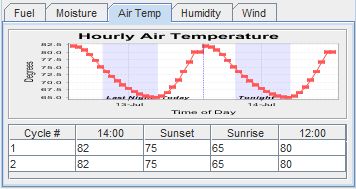
Figure 9. Air Temp tab showing air temperature cycle and editable table.
The Air Temp tab allows you to establish the yesterday's actual temperatures and today's forecasted temperatures. The table is used to set the parameters for the hourly temperature curves displayed in the chart.
These values affect the dead 1 hour and cured herbaceous fuel moistures.
Humidity - Yesterday and Today

Figure 10. Humidity tab showing relative humidity cycle and editable
table.
The Humidity tab allows you to establish the yesterday's actual relative humidity and today's forecasted relative humidity. The table is editable and is used to set the parameters for the hourly humidity curves displayed in the chart.
These values affect the dead 1-hour and cured herbaceous fuel moistures.
General Winds
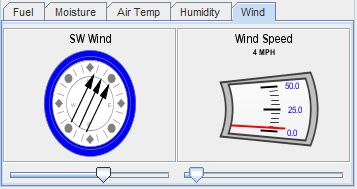
Figure 11. Wind tab showing general wind speed and direction with
slider controls
The sliders in the Wind tab allows you control the general wind direction and speed used throughout the fire behavior calculations.
When experimenting with the effects of wind, you may note that the wind speed also has a cooling effect on the fuel.
Location
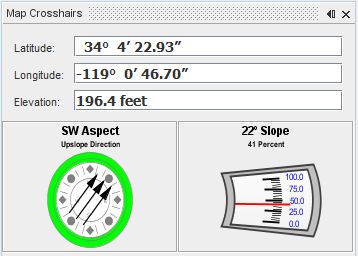
Figure 12. Map Crosshairs panel showing current location and terrain.
The Map Location panel shows the location of the map viewer's crosshairs. This location affects the terrain and aspect, the sunrise and sunset times, and solar preheating.


