The Art of Wildland Firefighting
A working paper by Doug Campbell and Bruce Schubert detailing the Campbell Prediction System, (CPS) consisting of selecting the correct information from observations, using logic to rank the importance of information and language to explain and express the desired outcome.
Contents
- Abstract
- Introduction
- The Situation
- Secrets of the Successful Firefighter
- Reading a Wildland Fire
- Learn from the Past; Predict the Future
- Using the Correct Information for Fire Behavior Predictions
- How to Predict Fire Behavior Change
- Logic for Tactics and Strategies
- Conclusions
Abstract
Wildland firefighters face variations in fire behavior that can be predicable, but unfortunately, too many fire fighters lack the training and knowledge to foresee these changes, resulting in unsafe and/or ineffective tactics that can lead to burnover accidents and/or the inefficient use of resources. The development of a reliable prediction system that would mitigate these problems included drawing upon the first hand experiences of seasoned firefighters, investigating the commonalities in burnover accident reports, analyzing and challenging fire weather and fuel moisture concepts, developing and field testing prediction and tactics on wildland fires and prescribed burns. The Campbell Prediction System has been developed to explain how firefighters can make predictions of fire behavior changes that may occur at any time, and make these predictions while on the fireline. This prediction system has been field-tested and validated on wildland fires and has prevented deaths and injuries of fire fighters from burnovers.
Introduction
Wildland firefighters face variations in fire behavior that occur under all fire danger situations. Some firefighters instinctively know when and where the variations may occur. Unfortunately, firefighters who do not know these things have a reduced situational awareness. Many burnover situations could have been avoided had they known how dangerous the fire potential was, and had they told others how they knew. Reading accident reports from the 1949 Mann Gulch through the 2006 Esperanza fires reveals that had the simple knowledge of when and where the variation was about to occur would have made a difference. It is better to leave early, rather than to stay until the fire runs you out.
The Campbell Prediction System (CPS) is a practical way to use on-scene observations to determine fire behavior strategies and tactics. With the Campbell Prediction System, logic replaces intuition, allowing an explanation of how tactics are developed. Scientific research combined with the knowledge of the successful firefighters' methods and practices are used to explain fire behavior. In these situations the observed fire behavior becomes the baseline, or signature, for fire behavior predictions.
The Campbell Prediction System enables you to:
- Identify and use the correct information to make fire behavior predictions
- Explain how you arrived at your prediction of fire behavior change
- Choose the tactic or strategy to utilize and explain how it was selected
- Display and communicate the predicted fire behavior on a map
Logic allows an explanation of what the fire is telling you, and reasoned tactics maintain effectiveness and safety.
The Situation
Wildfire suppression tactics are sometimes unsafe and can result in injuries and/or fatalities from burnovers. Prescribed burning projects sometimes escape control due to poor planning or execution.(1) Tactics fail as a result of fire behavior predictions that are either not made or are inaccurate.(2) Why do these events occur?
Firefighters do not have a simple and reliable method to assess the fire and fireground situations. Firefighters are taught to think about suppressing the fire and not to think logically of how the fire could thwart their plan. The firefighter's emotional hook to fight fire to often outweighs a logical approach and can lead to accidents. Firefighters that cannot explain the factors that cause fires to transition from controllable to beyond human control are more at risk.
Current training points to a dependence on staying informed of the air temperature, relative humidity, and the forecast wind direction and speed. These are generalities that are not specific to time and place; this data is not the best information to base a tactical plan on. Unfortunately, most scenarios use these fire danger elements and incorrectly expect that accurate fire behavior predictions can be made.
Statistics show that there is a weakness in the training of firefighters. Many rules and fixes for the problem have been implemented with no significant reduction in burnovers. Accident reports assign causes of fatalities to these weaknesses. Some blame it on attitude or leadership deficiencies. Others blame it on failure to obey the rules and "watch outs."(3) Reducing the rate of burnover and shelter deployments will require a new approach.
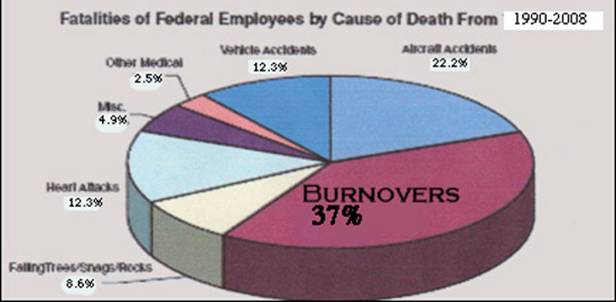
Figure 1. Burnover Fatalities for Federal Firefighters
(4 a)
(4a)
Secrets of the Successful Firefighter
Campbell writes, "In 1966, the Loop Fire (Angeles National Forest, CA) burned over the El Cariso Hotshot crew. The superintendent in charge had years of experience and was, in my opinion, a very knowledgeable firefighter. I came to the conclusion that if he could be caught in a burnover situation, then anyone could. That accident started my search for what was missing in our training. I wanted to find out what the successful leaders who worked on fires for years and avoided entrapments knew that others did not. That may be the secret.
"I sought to discover the secrets of the successful firefighter.
My curiosity began with asking, 'How did you know what was going to
happen?' No one could explain to me how he or she knew what the fire
was going to do in the near future.
Asking my mentors the same question
over the years, I failed to get the answers that I sought. Apparently
the knowledge was intuitive and did not lend itself to a simple set
of spoken words and phrases to explain the situation or the cause of
the change.
"I set out to discover how the experienced firefighters came to conclusions.
I would have to explain, show, and prove how one could view the scene
and arrive at a reliable prediction and tactic. Examining the training
programs and literature over a period of years, I centered on the primary
causes of fire behavior variations."(5) (6) (7) (8) (9) (10)
Reading a Wildland Fire
There are three primary forces causing variations in fire behavior. They are wind, slope, and pre-heat.(11)When these forces align, the fire is going to be at its maximum intensity. When these forces are not in alignment, the intensity is lower than the maximum. This is the alignment of forces concept. Each side of a fire, the head, flanks and heel, has a different alignment and intensity. For example, if the head is in alignment with the wind, then the flanks and heel will be out of alignment. Each of these alignment sets produces a fire signature, which is the observed fire behavior within the current alignment of forces. The fire signature is the ground truth. It is how the fire will behave in similar conditions.
The terrain will host replications of these fire signatures on those exposures that have a similar alignment. Where and when the alignment of forces in the path of the fire is similar to those of a previous fire signature, the fire behavior will be similar. When we identify how these forces are aligned ahead of the fire, and have paid attention to previous fire signatures, then we can more accurately predict the fire signature that will result.
What is important for situational awareness is when and where the fire signature will exceed the threshold of safety for the firefighter. This awareness becomes more accurate with practice.
A trigger point is a place on the terrain where a change in the alignment of forces will change the fire behavior, creating either opportunity or danger. Trigger points are a time and/or place the tactic or placement of resources needs to be changed to assure firefighter safety. There are two crucial trigger points to establish: one is where the fire will change; the other is when and where fire on the landscape triggers a decision to change tactics. Selecting a trigger point of change or the trigger point for tactical adjustment requires firsthand experience. Neither trigger point was established when the 1985 Butte Fire made an in-alignment run and drove firefighters into fire shelters.(12)
Learn from the Past; Predict the Future
The following is a case study showing the successful application of this method on the 1994 Dillon Fire, in the Klamath National Forest (California)
The Dillon Fire was located southwest of Dillon Creek. On the afternoon of August 12 at the peak of the solar heating time (1600 hours) it moved to a place where it was in full alignment with slope, wind and preheat: on the SW aspect with a SW wind. From there, the fire made a run to the top of the ridge through timber crowns with 150-foot flames. The following day, a small spot fire on top of a knob was detected by an early morning infrared flight. A firing operation along the burnout line had begun on the previous day shift and was planned for the following day shift, the day of the fire run.
Figure 2 is a shaded relief map illustrating this situation. The fire's run on the SW aspect is indicated with a red arrow on the left within the orange shading of the main fire. The wind direction is depicted with a blue arrow in the lower left. The burnout line and firing operation can be seen to the north and east of the main fire, as indicated by the brown line along the ridgeline and the firefighter icons. The spot fire is located between the main fire perimeter and the lower end of the firing operation.
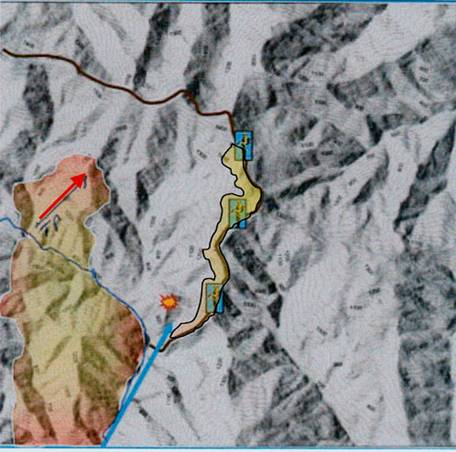
Figure 2. Dillon Fire Situation Assessment.
The Plans Section staff showed this information to the Fire Behavior Analyst and Operations Chief. The conversation went thusly:
This fire burned through the night and will continue to burn and move downhill. After the inversion burns off over the area, the fire will move faster. Let's identify where the fire may threaten the firefighters on the line.
The trigger point for a run is at the bottom of the canyon. There the fire will be in alignment with wind and slope on a hot aspect. When this happened before, the fire launched to the crowns of the timber and produced 150-foot flame lengths. The fire is telling you how it will behave. That run is very likely to occur sometime after 1600 hours. We recommend the firefighters on that entire burnout and holding operation be evacuated by 1100 hours.
At noon, the firefighters were sent to a safety area and the fire
made a run with the same signature as noted before. No personnel were
in the track of the fire when it made its run. The fire burned over
the ridge, and like the fire signature of the previous day's run, it
replicated to a slow moving ground fire that was quickly contained.
Figure 3 is an illustration depicting the potential fire behavior on
that day. It is similar to the actual graphic used on the fire. The
fire's predicted tracks are red arrows that emanate from
trigger points depicted with T's. The burnout tactic was
time-tagged to be off line at 1100. This illustration also
shows the actual run that the fire made on August 13, at 1732 hours,
represented by the orange shading in the center.
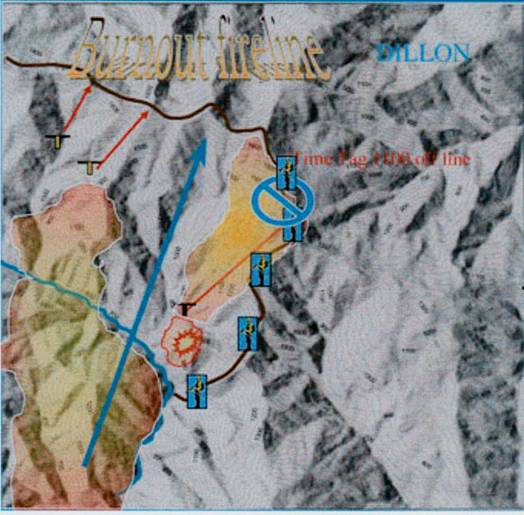
Figure 3. Dillon Fire trigger points, predictions and tactics.
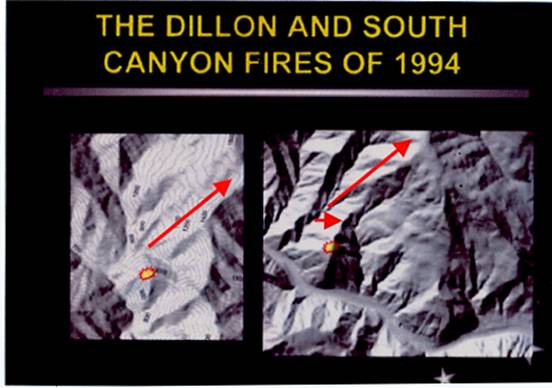
The behavior of the Dillon Fire has many similarities with the well-documented 1994 South Canyon Fire. (13) Figure 4 compares the Dillon and South Canyon terrain, and shows the spot fires and the fire runs made by both fires. The two fires are displayed side by side; the Dillon Fire is on the left and the South Canyon Fire is on the right. In both cases, the crews were working indirect. On the Dillon fire the crews were firing out the ridge top when a spot fire was located on a hilltop between the main fire and the firing job. Both fires had been burning all night and would continue burning out of alignment with slope until they reached the bottom of the canyon.
Dillon 8/14/1994
South Canyon 7/6/1994
Figure 4. Dillon and South Canyon Fire
Comparison
The similarities of the two fires are not unique. The fire situation began on a hilltop and backed downward to a trigger point where the fire found terrain that was in alignment. The trigger point for a run in alignment with wind, slope and near the peak time of the solar heating period is shown at the start of the arrows. The arrow indicates the track the fire took. The Dillon made its run at 1732 hours, the South Canyon at 1630 hours.
The difference, however, is in the outcome. The South Canyon firefighters failed to understand the fire's potential and they ran the escape route after the fire began its run. Thirteen firefighters perished. On the Dillon, the threat and trigger point were identified in advance and the firefighters were evacuated from the path before the run started.
There are many fires where this system could have made a difference in the outcome. CPS class exercises allow students to create solutions for some of the fatality fires.(14)
Using the Correct Information for Fire Behavior Predictions
Across the fireground, within a single fuel type on any given day, variations can be observed in the fire's intensity, rate of spread, and consumption of live and dead fuel. The primary forces that cause these variations are various alignments of wind, slope and preheat in the path of the fire.
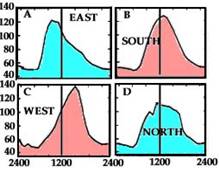
Figure 5. Solar Preheating by Time of Day and Aspect (15) Countryman 1966
The effects of wind and slope on a fire are well understood, however,
the topic of solar preheating and its effects on fuel moisture and fuel
temperature warrant further discussion. Air temperature and relative
humidity do not cause the differences in fuel flammability but instead,
it is the microclimatic variations influenced by solar radiation that
cause variations in fuel flammability and fire behavior. (15) (16) (17)
Solar radiation affects the moisture content of the fine fuels during
the daytime. On a sunny day, the solar radiation is heating the surface
of the sunlit fuels and driving off moisture. The relative humidity
is regulating how fast moisture can be driven off by radiation, but
it's the radiation that's heating and drying the fuel. Conversely, shaded
fuels have more moisture content.
Measuring the differences in temperature between sunlit and shaded fuels
in the fine fuel beds shows they correlate to fuel flammability variation.
Fuel temperature variation is easy to measure and has a more direct
effect on fuel moisture than calculations of humidity. Figure 6 shows
the fuel temperature being measured on sunlit and shaded fuel beds using
an infrared thermometer. The sunlit fuel is 104 degrees F whereas the
shaded fuel is 71degrees F. When these photos were taken, the air temperature
was measured at 70degrees F and the relative humidity measured 30%.
Your observations of fire signatures in both solar preheated fuel and
shaded fuel will tell you how much difference it makes in fire intensity.
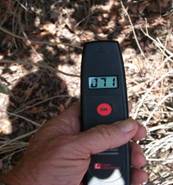
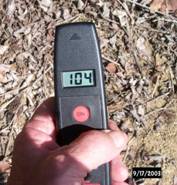
Sunlit Fuel Temp: 104 degrees F Shaded Fuel Temp: 71 degrees F
Figure 6. Fuel temperatures variations measured with an infrared thermometer.
To establish the fuel flammability curves for a specific location use the Shadommeter (Figure 7). The Shadommeter was used on fires to determine the time each aspect reached the peak solar heating period and to determine the surface temperature variation.
Figure 7. Shadommeter (14)
To utilize this idea in a predictive way, categorize the various terrain aspects as hot fuel beds and cool fuel beds that are either heating up or cooling down. Hot fuels burn with more intensity than cooler fuels because the temperature is closer to ignition and the fuel is dryer. The effects of solar preheating can be seen in the following photographs (Figure 8) from the Zaca Fire. These photos represent four changes in the fire signature of a topography fire that is out of alignment with wind and slope but in a fuel bed that is being heated and dried by the solar effect. Note how the fire intensity increases as the sunlit fuels are heated throughout the day.
Morning
Noon
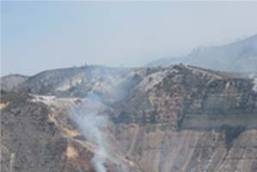
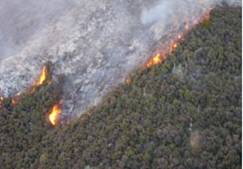
3 p.m.
6 p.m.
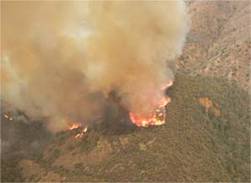
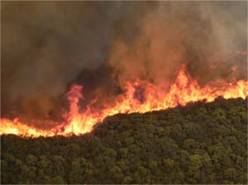
Figure 8. Fuel flammability and fire signature variation on a daytime
topography fire.
Thermodynamic studies have shown that a chemical reaction will double for every 18 degrees (F) increase in temperature.http://www.google.com/search?hl=en&client=safari&rls=en&q=chemical+reaction+doubles+with+18+deg.f&btnG=Search
Prediction of fire behavior change becomes simpler when you use the fire behavior elements of wind, slope and preheat to explain the cause of the variations in fire intensity and flame lengths.
How to Predict Fire Behavior Change
Here we have an example of how to use the CPS logic, information and language to predict and explain fire behavior changes. Figure 9 shows two photographs of a test burn. (18) In these photos, there are sunlit and shaded fuels and a 3 mph wind blowing from left to right; the head fire in the left hand photo has 10' flame lengths. Wind, slope and preheat are acting on the fire to either help or hinder the spread. The alignment of these forces make the fire burn with more intensity and when the forces are out of alignment the fire behavior ebbs. Observe how the fire signatures change as the alignment of forces change. Examine these snapshots and ask yourself the following questions:
- What is making the fire burn with different intensities?
- What is the cause of the variations seen in these two pictures?
- What is the fire telling us?
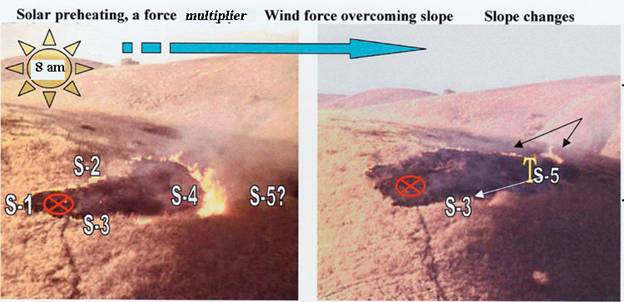
9:43 AM
9:48 AM
Figure 9. Footprint Test Burn (18)
(S) Stands for fire
signature
Logic: Knowing there will be a reduction in flame length when the fire gets to the S-5 location, it makes sense to wait and engage the fire after it goes out of alignment. (19) You'll notice that neither air temperature nor humidity measurements are necessary to make this prediction.
Language: It is important to wait and see what the fire does as it burns into a different area. The slope, solar preheat and wind on the fire will change. This fire went out of alignment with wind, slope and preheat when it burned over the small ridge. It was a topography ruled fire with wind domination. If the wind quits the fire will turn up slope. To suppress this fire enter the fire at S-3 and work along the S-2 flank using the burn as the safety area. When the fire goes out of alignment then turn the corner with a direct attack on what was the head. This is a two or three person hand crew task.
Understanding the alignment of forces on a topography fire and knowing how to describe the fire in terms of alignments goes a long way toward seeing where the fire will get worse or easier. [T] Is the trigger point of fire behavior change that becomes an opportunity for control. Explaining the fire before selecting the tactics is an important safety issue. This is a lesson in how to compare the alignment of forces to the fire signatures and predict changes before they occur. The fire signature at S-5 is an out of alignment signature and it replicates the shaded lower flank signature S-3.
Logic for Tactics and Strategies
Tactics need to be considered when and/or where there may be significant variations in the fire behavior. Knowing when and where fire behavior will change for the better or worse is crucial to firefighter safety and situational awareness. The best relationship for a tactical advantage is to engage the fire during the time the fire is getting easier rather than worse. To borrow from Sun Tzu, "attack when your enemy is lax."(19)
The dominant force could change from slope, to wind, to preheating. Any one of these forces can dominate the fire behavior. This is important because if the dominant force changes, the character of the fire will change also. For instance, a wind driven fire will, in effect, flatten the effects of terrain and reduce fuel temperature and moisture variations. When this fire burns to a location that is sheltered from wind, a new dominant force will drive the fire. For example:
In California, a strong Santa Ana wind drives the fire toward the Pacific coast and then weakens on the third day. Now slope and preheat forces come into play. The fire will behave differently because the dominant force has changed. The tactical match for the type of fire needs to be adjusted (see Table 1). Now there may be opportunity, but also danger because it has become less stable.
Each type of fire requires a different tactical approach. Wind driven fires require a flanking attack. Fuel dominated fires require an indirect attack. Topography fires require a tactical evaluation and the use of time tags.
|
Type of Fire |
Tactic |
|
Wind Driven |
Flank |
|
Fuels Fire |
Indirect |
|
Topography Fire |
Time Tag |
|
Angry Fire |
Move Away |
Table 1. Fire Behavior Tactics
If the fire burns into a different fuel type, wait until you can see the fire burning in the new environment and use its behavior and alignment with the forces on the fire to develop new fire signature concepts. Recalibration of the fire signatures needs to be done whenever the fire burns into another fuel type, when the dominant force changes, or when there are significant differences over time or terrain. A wise firefighter once said, "Wait until I can figure this out."
The CPS Flammability Card (Figure 10) is most useful in topography and fuel dominated fires. This graph illustrates the fuel/aspect temperature variation on the four primary aspects.
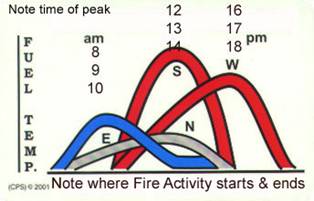
Figure 10. CPS Fuel Flammibility Card (14) Campbell 1991
Topography maps can be shaded on the south and west aspects to highlight the increased flammability of fuel beds on these aspects. Figure 11 is an example of a hot slope map generated by a GIS system augmented with compass rose showing the daily wind changes in direction. Placing the wind direction on the hot slope map shows the alignment of wind over terrain. Afternoon wind aligned with hot slopes is an indication of dangerous ground.
Forecast winds for the day shift.
Morning wind SE 0800 to 1100
hours. Afternoon wind WNW 1200 to 1900 hours.
a.m.
![]()

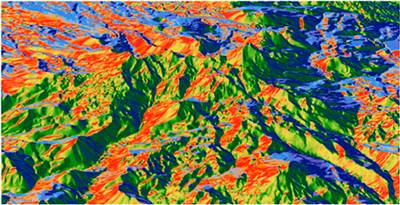
Figure 11. Hot Slope Map with Wind Arrows. (20)
Tactics Planning Procedure:
- Match the type of fire to the tactic (Table 1)
- Draw the wind direction on the map (Figure 2)
- Show trigger points and fire tracks on the map (Figure 3)
- Know where you are on the flammability-curve (Figures 10 and 11)
Identifying the trigger point of where or when fire behavior will change is an important tactical procedure. Time tagging a tactic based on previous fire signatures helps identify dangerous tactical time periods. In the preceding photos of the Zaca Fire (Figure 8), we saw evidence of what solar heating variations over time will do to a fire. Although the fire spread is out of alignment with slope and wind, it is spreading on a west aspect and the preheating is going up the curve. The best time period to attack with good results would be before 1400 or after sunset when the solar preheating force-multiplier is gone. Crew supervisors should develop their tactical plan after viewing their assignments and make adjustments such as time tags.
Tactical Evaluation Steps:
- Establish Trigger Points of Change
- Indentify the In-Alignment Tracks
- Determine Fire Signature Threshold of Control
- Time Tag the Task
- Make Signature Predictions
- Select the Tactical Plan
- Establish L.C.E.S.
The Campbell Prediction System provides the steps needed in a complete evaluation of a fire situation. The logic, information, and language used to evaluate and explain the fire situation are prerequisites to a good tactical plan.
Figure 12.
Management team discussing tactics using a solid terrain
model on the Kirk Fire LPF 1999 (21)
It would improve situational awareness if the Operations Chief and those below in the ICS were trained to identify and display the fire potentials. In briefings the Operations Chief could order the fire overhead assigned to the fireline to consult their maps and mark on them the trigger points and tracks the fire would take.
Technological Advances
New tools are being used
to augment the collection of fire behavior observations, and to enhance
the fire behavior prediction opportunity.
Bruce Schubert of AeroComputers has developed an airborne system, which leverages aircraft-mounted gyro-stabilized cameras (infrared and/or daylight) to gather wildland fire behavior signatures, and to map the perimeter of these fires by simply tracing the fireline with the camera's cross hairs. This system produces GIS shapefiles and both geo-referenced video and screenshots of fire signatures to aid in the evaluation of past and current fire behavior. The system continuously geo-references live video so that the latitude and longitude of the cross hairs displayed on the operator's screen are recorded. At the same time, the AeroComputers system overlays scale bars on the video image to measure flame height and help provide context to the live video being collected. The data can be simultaneously transmitted to the ground for immediate consumption. (22)
Schubert is designing a decision support and training tool that integrates the disciplines of GIS and the new field of data mining with the logic embodied by CPS to render potential fire behavior and the thresholds of control in the path of a fire. This system will determine potential fire behavior across the fireground by analyzing the observations from an active fire plus an aggregate of observations from past fires. The system is being designed for use in the classroom and the Situation Status Unit.
Conclusions
Much of the fire behavior training prior to the final advanced fire behavior class (S-490) was designed to enable students to accomplish fire-modeling tasks. The Fire Behavior Analyst is part of the fire team who attempts to utilize the training to add to the information in the Incident Action Plan. How does it work when developing a tactical approach on wildland fires? Experienced firefighters used their intuition to fight fire effectively and safely for years. How the successful ones accomplished dangerous jobs is not well known. They did not use the fire modeling system to accomplish the tasks.
The Campbell Prediction System was developed to augment the fire
modeling design weakness as described by scientist Richard Rothermel.
Rothermel has long had the distinction of being the Guru of fire behavior
for wildland fire prediction. His evaluation of his invention follows.(23)
"The mathematical model has application to management problems in
two situations:
1. The "hypothetical fire" situation in which
operations' research techniques are utilized for fire planning, fire
training, and fuel appraisal.
2. The "possible fire" situation for which advance planning is needed, such as fire-danger rating and pre-suppression planning. Predictions of potential fire severity for possible management practices (i.e., methods of thinning, slash treatment and prescribed burning) have the potential for being the most valuable contribution that fire modeling can perform.
A third situation -- forecasting the behavior of existing wildfires -- will require a greater degree of sophistication than this model and our knowledge of fuels will permit at the present time. Variations in fuel and weather cause departures from predicted spread and intensity that pose risks unacceptable in fire suppression activities. A method for forecasting the behavior of a specific fire eventually will be developed; most likely, it will be patterned on a probability basis similar to that used for forecasting weather. To accomplish this, a technique must be developed for rapidly updating fuel inventories on the threatened site.
CPS has been on many wildland fires. The logic program and fire signature
concepts have been field-tested while operating as a Type Two Incident
Commander, Type One Operations Section Chief and as a Fire Behavior
Analyst and it was accepted well and worked well. During a ten-year
period while working for the Ventura County Fire Department as the Fire
Behavior Analyst, CPS was tested and improved on over ninety prescribed
burns.
During the past eighteen years Doug Campbell has taught
CPS to more than thirty five hundred firefighters in the U.S., Spain
and Canada. A two-day investment has produced logic in the firefighter's
toolbox and a way to explain how they know how the fire will behave
and how they modified the tactic and remained effective and safe during
hazardous situations. The accuracy and viability of the method
student evaluation rated the program over 90% very useful. Those who
have attended this training program have reported they have used this
information and avoided potential burnovers.
There are numerous fire personnel who have utilized CPS on wildland
fires and are qualified to teach the subject. Doug Campbell has
retired from teaching. He is however open to teach instructors
and furnishing the course material on a one-on-one basis to those individuals
interested in instructing the CPS course.
References
1. National Park Service. Cerro Grande Prescribed
Fire, Board of Inquiry Final Report. 2001.
2. Gonzales,
Laurence. Deep Survival: Who Lives, Who Dies, and Why.
3. Incident Operation Standards Working Team.
Incident Response Pocket Guide. s.l. : National Wildfire Coordinating
Group.
4. Wilson, C. C. Fatal and Near-Fatal
Forest Fires, the Common Denominators. 1988.
4a.
http://www.wildlandfire.com/docs/2007/cause-death-fed-ff-90to08.htm
5. Countryman, C. M. Radiation. PSW Forest
& Range Experiment Station : USDA Forest Service, 1976.
6. The
Fire Environment Concept. PMS 433 : USDA Forest Service, 1972.
NFES 2166, 1972.
7. This Humidity Business.
What it is all about and its use in fire control. s.l. : Pacific
Southwest Forest and Range Experiment Station, 1971.
8. Countryman,
C. M. and Dean, W. A. Dean. Measuring Moisture Content
in Living Chaparral: A Field User's Manual. s.l. : USDA Forest
Service, 1979. Gen. Tech. Rep. PSW 36, 27 P..
9. Fischer,
W. C. and Hardy, C. E. Fire Weather Observer's Handbook.
s.l. : USDA Forest Service , 1976. Agric. Handbook 494.142 p.
10. Greenlee, Jason M., Thomas, David and Gleason, Paul.
From Cosmos to Chaos: Deja Vu or Vu Jade? 1996.
11.
Campbell, Doug. The Campbell Prediction System.
Ojai, CA : s.n., 1995.
12. NWCG. 1985 Fire
Entrapment Incident Review. s.l. : National Wildfire Coordinating
Group, 1986.
13. South Canyon Fire Investigation Team.
South Canyon Fire Investigation. August 17, 1994.
14.
Campbell, Doug. The Campbell Prediction System
Workbook II. 2003.
15. The Concept of Fire Environment,
Fire Control Notes. Countryman, C. M. 4, s.l.
: USDA Forest Service, 1966, Vol. 27.
16. Barrows, J.S.
Fire behavior in the Rocky Mtns.
17. USDA Forest
Service. Fire Weather Handbook 360. 1977. NFES 1174.
18. Ventura County Fire Department. Boundary RX
1995. [DVD] 1995.
19. Tzu, Sun and Cleary, Thomos.
The Art of War. 1988.
20. Lunder, Zeke.
Hot Slope Map. NorthTree Fire International, s.l. : s.n.
21. Solid Terrain Modeling Inc. [Online] http://www.stm-usa.com.
22. AeroComputers, Inc. UC5100 Mission Management System.
s.l. : AeroComputers, Inc.
23. Rothermel, R. C.
A Mathmatical Model for Predicting Fire Spread In Wildland Fuels.
s.l. : USDA Forest Service, 1972. INT-115.
Additional Information:
Lessons Learned. [Online] http://www.wildfirelessons.net/Additional.aspx?Page=84.
Wildland Fire website publications. [Online]
access:
http://www.wildlandfire.com/arc/arc.htm
- docs
A Case for Using Wildland Firefighter Mission & Vision Statements
to Determine a Firefighters ETHICS. [Online]
http://www.wildlandfire.com/docs/2004/mission_vision.htm
Another Way to Prevent a Reoccurrence - Cramer [Online]
http://www.dougsfire.com/articles/
A power point slideshow about solving the Cramer Fire Incident using
the Campbell Prediction Method. The Fire Signature Prediction method
is a logical method for looking at current and expected fire behavior
that allows ground-pounders to determine safe firefighting tactics.
Includes similarities between Cramer and South Canyon. 3/04.


- Home |
- Contact |
- Policies |
- Top of Page
Copyright © 2009-2015 Emxsys. All Rights Reserved. Emxsys is a trademark of Bruce Schubert.